Back at the Mayo Clinic in Scottsdale, our primary research interests were studying insulin resistance in skeletal muscle. In healthy individuals, muscle is expected to take up the majority of glucose after a meal, and this process is driven by the hormone insulin. In type 2 diabetes, the insulin hormone is elevated, but the muscles ignore it. Our job is to figure out why.
While measuring the bloods glucose level is a useful metric, it’s not a terribly quantifiable measurement for how effective insulin signaling is working. Instead, we use a technique called a hyperinsulinemic euglycemic clamp, which was perfected in the lab of my PhD advisors (Larry Mandarino) PhD advisor….. Ralph DeFronzo, making him my scientific granddaddy 🙂
So here’s what we do. At the start of the experiment, we inject insulin into the test subject at high dose, which tells all peripheral tissues in the body to take up excess blood glucose. We then closely monitor the patients blood glucose, and if it dips below a setpoint, we infuse glucose to compensate exactly, maintaining the blood glucose at a level of 100 μU/ml for a lengthy period of time. At the end of the experiment, we know how much glucose has been infused, and since the blood glucose level is the same, we also know exactly how much glucose has been absorbed.
The glucose infusion rate must equal the glucose disposal rate. Furthermore, we can divide the glucose disposal rate by the estimated weight of skeletal muscle in the subject, giving us the “M value”, which has units of mg glucose / (min * kg of lean muscle).
You can clearly see my sense of humor remains unchanged
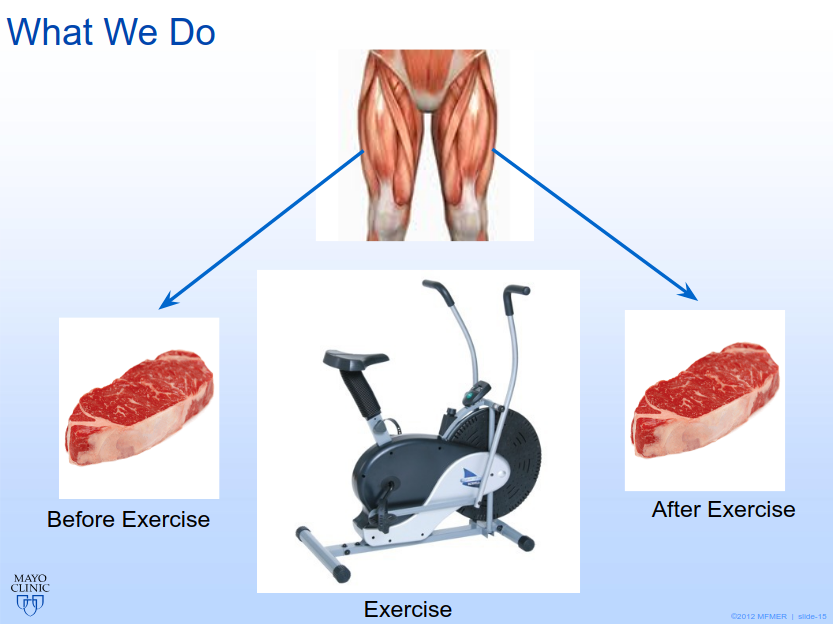
At the Mayo, we would perform these experiments, but also take a small-sized muscle biopsy out of one leg. Several days later, we would make the test subjects exercise on a stationary bike, and then take a muscle biopsy out of their other leg….. FUN
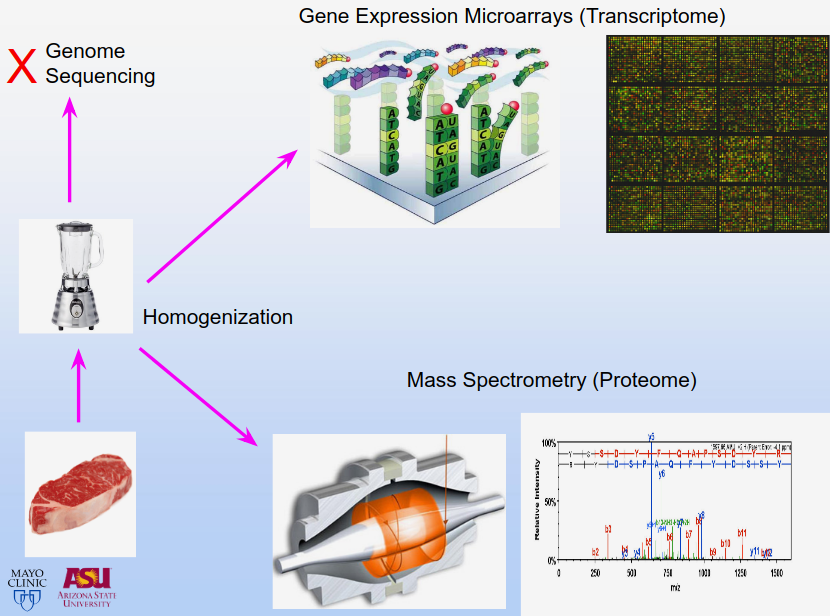
And what can you do with these small hunks of human legmeat? Well, we homogenize them in an overpriced laboratory blending instrument to make a nice liquid muscle goop, and then measure the proteins in that muscle goop. We can also determine which genes are turned on and off, which is known as gene expression analysis. We can do this to determine which genes are activated before exercise, after exercise, and also which genes changed the most after exercise, which tells us a great deal. Typically, when these studies are done, statisticians focus on the biggest changing genes, which tend to be high-abundance metabolic enzymes in the mitochondria.
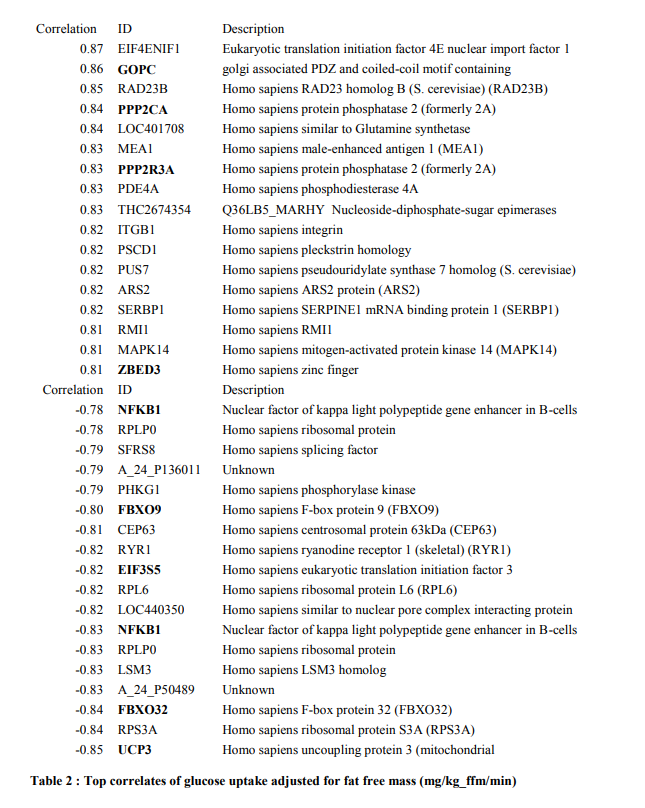
I had a different idea though. Instead of looking for the most statistically significant changers, I looked for genes that correlate strongly with external biomarkers of the subject, like glucose disposal rate (M value described above) and body mass index. When I ran these correlations, I found a number of low-abundance signaling molecules that barely change after exercise but correlate strongly with these external phenotypes. When digging into the functions of these genes, I found a great deal of signaling pathways that track diabetes genomics.
In fact, I found so many interesting genes, that I’ve decided to make the description of this experiment its own separate blog entry, and in subsequent blog entries, I will describe single genes of interest and the pathways that they encapsulate. For those of you who are impatient for the laypersons explanation of everything, my dissertation is a deep dive.
Even better, this link will allow you to see my original PhD defense slides online, with graphical descriptions of all of these pathways.
Correlations of gene expression with glucose disposal rate, before exercise
If we just take the gene expression patterns of muscle, before any exercise intervention, and correlate them with insulin-stimulated glucose uptake rates, we get some neat postitively-correlating genes in the WNT signaling axis, which are the upstream components that activate the TCF7L2 transcription factor that I described in my writeup on BPA.
At the bottom of the list, we have negatively correlating genes with glucose uptake. When these genes are activated in muscle, the subject is insulin resistant. These genes largely make up the pathways responsible for muscle protein breakdown, starvation signals, and the inflammatory NFKB pathway that activate these atrophy and muscle-wasting pathways.
Correlations of exercised-induced gene expression changes with glucose disposal rate
In this table of correlations, we ask the question of which genes change with exercise in a matter that best correlates with the subjects insulin sensitivity. The most exciting hit is ACP5, which was a clue that lead to a great deal of findings for me.
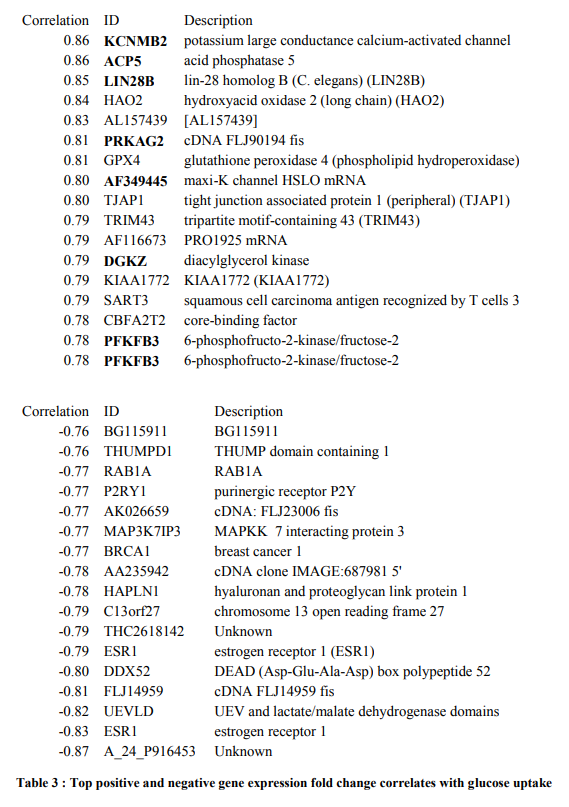
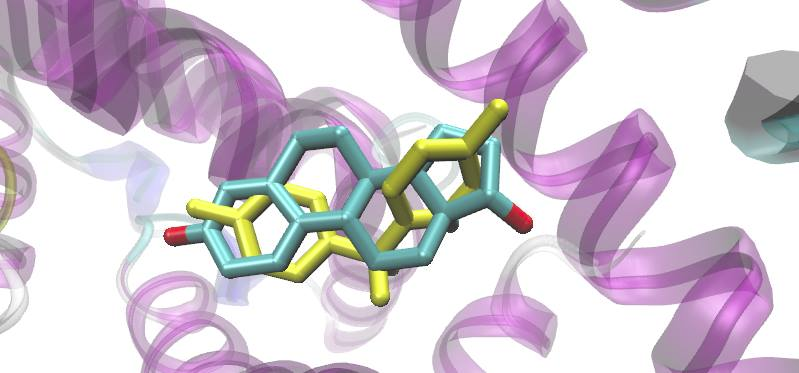
And of course, the estrogen receptor, ESR1, which BPA binds to and somehow impacts TCF7L2 signaling 🙂
Just for fun, gene expression patterns that correlate with BMI
<coming soon> ….. neat stuff be coming …..!